How the Energy Balance Sheet Enhances Corporate Strategy
Increasingly, businesses are realizing the need to lower their energy use and, therefore, their associated carbon footprint. They understand that not only do customers demand it, but if done effectively it enhances their bottom line while also helping mitigate unhealthy environmental consequences and even providing social benefits.
However, many organizations are limiting their green activities to what appear to be the obvious initiatives based on relatively simple energy reduction evaluations. They do so because the most common standard of analysis is based on either a cash flow payback or profit and loss approach.
As we will show, these analyses are very limited, far from comprehensive evaluations. The result is an inadequate consideration of all the interrelated risks and opportunities that can be managed for greater business value by identifying the right initiatives. This can be accomplished with an approach we call the Energy Balance Sheet.
Introduction: Energy Balance Sheet
Let us start with a financial analogy. The financial balance sheet is a snapshot in time that describes the status and health of a company. It tells you what you have, assets, and what you owe, liabilities, with the difference being the value, the shareholder equity created. Common categories of assets include cash, current assets, and non-current assets, where current assets mean within the fiscal calendar year and non-current assets means beyond the fiscal calendar year. The same applies for current and non-current liabilities. Now let’s use this as inspiration to develop the energy balance sheet.
An energy asset has the same definition – something the company owns that can be turned into future economic value. Financial assets translate easily to energy assets. Examples include (see Figure 1):

Figure 1: Example components of an Energy Balance Sheet
Stored energy such as in a gasoline tank or grid-scale battery
Ability to self-generate electricity such as solar, or access to grid electricity
Equipment reserve fund to fix a broken generator or a broken air conditioner
Capital budget reserves designated to replace end-of-life equipment
And, of course, physical property, plant, and equipment to run the business
Let’s now look at liabilities. An energy liability is an obligation to spend against the asset. Examples here include:
Utility and other energy bills you have to pay
Diesel to run generators
Expenses of operating solar panels
Environmental compliance and hazardous waste disposals costs borne due fuel use or other hazardous chemicals
Backup power or emergency battery purchases to maintain a 24/7 data center
Whatever isn’t spent on liabilities can then be directed for productive uses such as building widgets or offering services.
As we said, the asset and liability difference in a financial balance sheet is current value or shareholder equity. With the energy balance sheet we consider this difference, this equity, to be productivity – or the resources left over to drive profit – with the co-benefit of lowering detrimental environmental impacts.
We consume energy for economic benefits. Thus, whatever is left over from managing the energy assets becomes part of our production capabilities whether it be goods or services. If there’s any energy left over beyond that, and if there's a storage mechanism, we can even use that residual energy for the next reporting period of the future balance sheet. Normally in today’s world almost no organization has the means to store energy, so that’s typically zero.
Case Study: College Housing

Figure 2: Campus Corner, managed by the Green River College Foundation
Let's examine a case study of how the energy balance sheet can help assess risks, determine opportunities and result in a strategic energy plan of initiatives. The Green River College Foundation in Washington State, USA, owns and runs the student housing complex at the college. About a decade ago the foundation purchased these 11 buildings originally developed as low income housing. They comprise 89 four person apartments, a student recreation room, a laundry and business offices.
Due their 10 year plus age and that construction was not optimized for maintenance and efficiency, the energy footprint in these buildings was quite a mess with operating costs increasing. In fact, energy consumption was the second highest cost after payroll. Wasted energy was estimated to be well over $100,000 per year. Plus, unique for a regional college, Green River educated an international body of business students where a majority came from much warmer climates than Washington state. Thus, they liked keeping their apartments toasty warm. Compounding the situation was a three-person facilities and property management team stretched to their limit overseeing the student renters who typically turned over every two semesters and the overall operations.
Though the executive director and his board members recognized possible mitigation opportunities, they didn't know where to start. Previous efforts to reduce energy costs simply forbid students from raising apartment temperatures and assessed penalty fees over a threshold for high utility bills. But then students started moving to off-campus housing. This represented lost revenue and thwarted an opportunity to build an engaged student community.
Much needed was a strong vision to guide strategy. In this particular case student satisfaction and comfort to maintain college reputation and enrollment were chief concerns. Yet this had to coincide with maximizing rentals at a reasonable operating cost. During deliberation, the idea arose that with the right energy strategy a good portion of energy cost savings could be redirected to enhance student programs.
A final energy vision statement evolved: Be resource efficient and cost-effective without compromising student comfort while helping these young adults grow as responsible consumers. This vision guided interactions going forward with the college community, feedback from students and staff, through the energy plan and goals, as well as the metrics-for-success.
The first step was to gain certainty by gathering utility, operations, occupancy and financial data, as well as develop initial performance metrics to establish baselines. An essential piece of data gathering was interviewing students for their feedback and experience living in these apartments. The facilities team was also consulted to understand the day-to-day operations and how they ensured the maintenance, safety and comfort of the buildings.
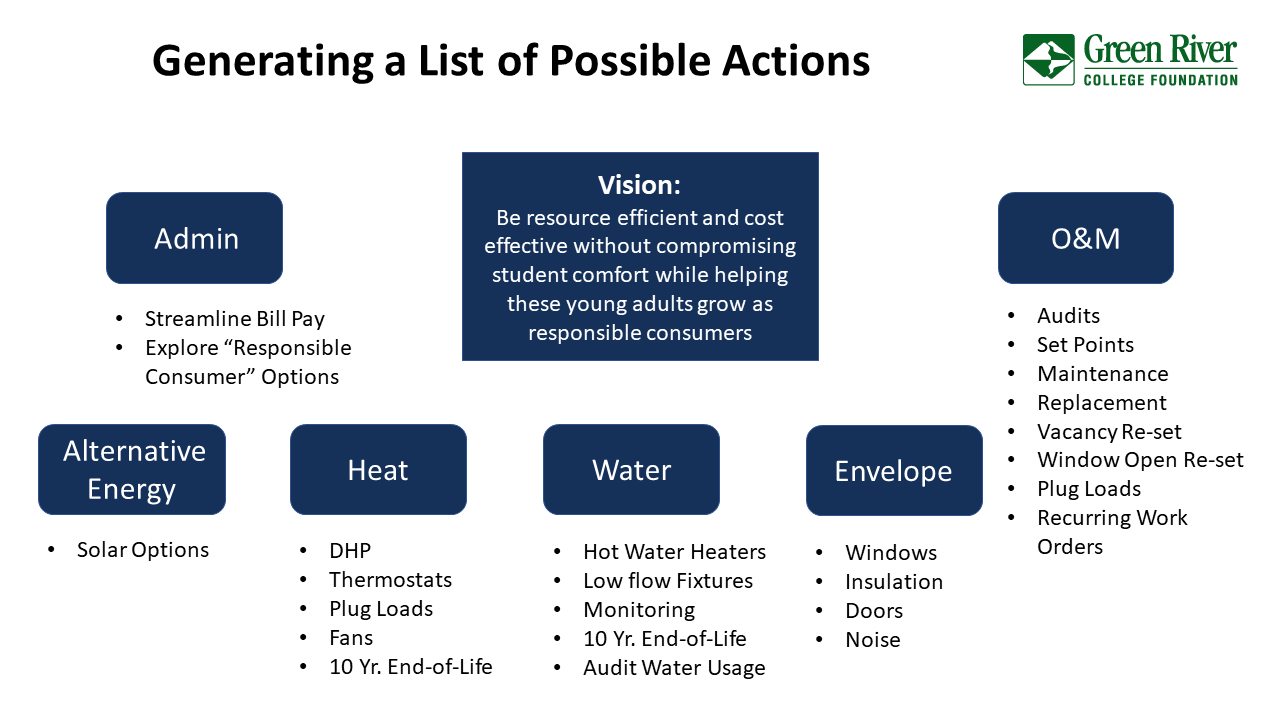
Figure 3: Generate a list of concerns and actions
Before trying to develop solutions , the issues and concerns were clarified and categorized. This revealed what problems were related and which ones were independent. There were quite a number of operations and maintenance headaches that were acknowledged, but until mapped out, no one saw the interconnections throughout the apartment campus’ energy ecosystem. The final six categories delineated were:
Administrative overhead,
Building envelope,
Heating,
Water,
Alternative energy, and
Operations and maintenance.
Within each category the known problems, known solutions, and various initiatives to investigate were listed. As you can see in Figure 3, the options spanned a broad range including automated processing of 100-plus individual utility bills, examining alternative heating solutions such as ductless heat pumps, replacing inefficient end-of-life equipment and creating a revolving fund to supplement the foundation’s capital equipment reserve. Arranging this list into the format of the energy balance sheet showed all the connections between activities and revealed the best opportunities to meet the foundation’s vision.
Applying the Energy Balance Sheet
When all of the different possible actions were organized into assets, liabilities and productivity, clear insights evolved as seen in Figure 4. The asset side had a good number of facilities and equipment related to heating: thermostats, fans, water faucets, windows, wall insulation and doors. Every one of these assets had an impact on energy, whether increasing consumption or decreasing it.

Figure 4: Categorizing the list of concerns and actions into the Energy Balance Sheet reveals which initiatives to take.
On the liability side, many headaches were continually faced by the staff. Representative of the issues were repeatedly helping students manage their thermostats for comfort, a backlog of maintenance often due old infrastructure and repairing apartment appliances because of improper student use (i.e. flushing cooking grease down the toilet). The net of these liabilities was to take away staff time from proactive measures including educating new student renters on how to best manage their apartments and use the appliances.
Ultimately, what's impressive about the energy balance sheet is the clarity of the interrelationships between assets and liabilities. For example, a wireless digital thermostat might be a solution to solve three liabilities: the set point, the vacation reset and monitoring temperature. Likewise, the 10-year-old, end-of-life replacements, pointed to several different pieces of equipment such as fan motors and hot water heaters that replacement would save many hours of repair costs.
Another plus of the energy balance sheet is facilitating the phasing of actions. Before replacing hot water heaters, it might be best to install low flow faucets, efficient dishwashers and shower heads to reduce overall hot water consumption. This in turn reduces required hot water tank capacity saving capital costs and lowering the costs of electricity, water and sewage water. Thus, assets and liabilities examined together in an energy balance sheet provides the framework and a strategic roadmap that can be aligned with an organization’s resources and goals.
At Green River, replacing manual thermostats with programmable ones was the first phase. It was the least costly equipment upgrade solving multiple problems at once. Testing in a pilot program reduced heating energy costs approximately 7% and the impact on students was nil. When a student returned to their room after a long day, they simply pushed a button to activate the desired temperature and went about their business. No longer did they face an unbearably hot room from leaving the heat on high all day. Comfort increased and money was saved. When the program went complex wide, their Energy Star rating improved from 48 to 78, out of a possible 100 points. With the revolving fund in place capturing savings, funds freed up that could be invested in both the next phase improvements as well as to bolster student programs.
Additional phases, over five-year period, included heating and lighting upgrades and kitchen appliance replacements, resulting in an energy savings reaching 30% in most apartments while lowering the foundation’s required capital reserves and utility budgeting. The Energy Balance Sheet was the key vehicle for laying out this strategic energy plan.
In summary, the Energy Balance Sheet is an essential tool to understand the physical assets and liabilities that a company owns and is exposed to as relates to energy. Hidden opportunities can be mapped out across assets and liabilities exposing the initiatives that have co-benefits for increasing assets and decreasing liabilities at the same time. Thus, an energy asset is far more than just the consumption of the resource. It encapsulates capital costs related to the energy infrastructure. To review, like their financial corollaries, energy assets are what an organization owns that can be turned into future economic value. Energy liabilities are an obligation to spend against the asset. The net, energy productivity, is the residual that can be used for meeting product and service targets while reducing the organization’s carbon footprint and increasing its value.